How to switch Google Map dimensions using a Parameter in Data Studio
So in this post I’ll share a method for switching Google Map dimensions using a Parameter in Google Data Studio. Parameters were recently introduced in Data Studio and have many use cases!
Before we begin…
Before I begin I need to say that if you are interested in learning more about parameters in Data Studio you read this article: Google Data Studio secondary dimension like inside Google Analytics by Mehdi Oudjida as it explains very clearly how to use parameters in Data Studio. I was familiar with parameters from Tableau but Mehdi’s blog posts helped me understand how to implement it properly in Data Studio.
Also check out Mimoune Djouallah on Twitter who regularly posts innovative ways to use parameters in Data Studio!
The need for switching between metrics in a Google Map
While most charts in Data Studio allow you to switch between dimensions using drill down or switch metrics by using Optional Metrics, Google Maps currently do not allow you to switch dimensions or metrics. Therefore if you wanted to show three different location dimensions such as Country, Region and City data in one report you’d have to have three Google Maps.
So the practical purpose for this ‘hack’ using a parameter is the ability to switch between three geographic dimensions and only needing one map.
Step 1: Create a parameter
Open up your added Data Studio are click on ‘Add a Parameter’ in the top right hand corner of your screen.

We will call this map_parameter and set it up with the following details
Data type = Text
Permitted values = List of values
Values =
Country
Region
Town/City

Step 2: Create a calculated field for Map dimension 1
So we need to create the first of two calculated fields.
This is pretty simple and just has the map_parameter we just created as the calculation as shown below. I will name it ‘Map dimension 1’.

Step 3: Create the second Calculated field; Map dimension 2
This second calculated dimension is what we will be adding to our Google Map.
It’s a CASE statement based on ‘Map dimension 1’ which we just created.

The CASE statement for you to copy and paste is below.
CASE Map dimension 1
WHEN 'Country' THEN Country
WHEN 'Region' THEN Region
WHEN 'Town/City' THEN Town/City
ELSE "Other"
END
Once we’ve created Map dimension we should have the following custom metrics and parameter in our data source.

Step 4: Building our Data Studio report
Let’s start building our Data Studio report by adding a Google Map with Location being ‘Map dimension 2’. The metric can be Users. It’s default value is country.

We can also add a table with the same dimension (Map dimension 2) and Users as the metric.

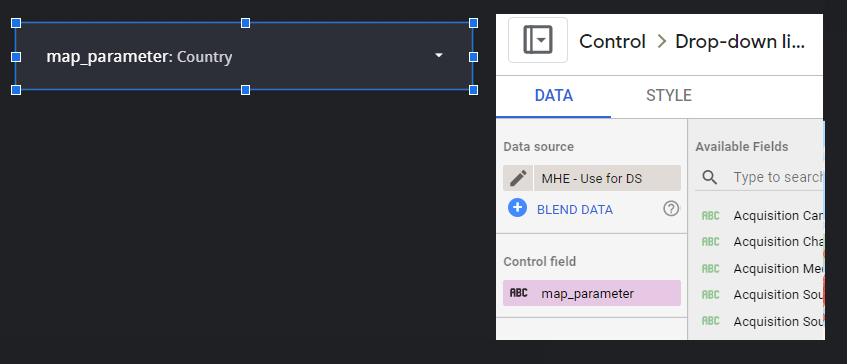
The final and most important thing to do is to add in our Parameter as a Drop down control box.
The control field is the map_parameter we created earlier.
Step 5: Using our Data Studio report
Below is a video showing how you can use the parameter control to switch between Location types on your Google Map.
The actual Google Data Studio report
Here is the actual Google Data Studio report if you’d like to take a look yourself. Please note that in order to actually interact with the the Google Map you’ll need to open the report in Google Data Studio itself by clicking on the logo in the bottom right corner of the embedded report to open it in a new tab.
My Other Blog Posts
If you enjoyed this blog post about how to switch Google Map dimensions using a Parameter in Data Studio you might find my other articles interesting!


Unfortunately, this seems to be working only for “bubble map”, not for the filled areas type.